- Shannon P, Markiel A, Ozier O, Baliga NS, Wang JT, Ramage D, Amin N, Schwikowski B, Ideker T. Cytoscape: a software environment for integrated models of biomolecular interaction networks. Genome Research 2003 Nov; 13(11):2498-504
What is Cytoscape?
Cytoscape supports many use cases in molecular and systems biology, genomics, and proteomics:
- Load molecular and genetic interaction data sets in many standards formats
- Project and integrate global datasets and functional annotations
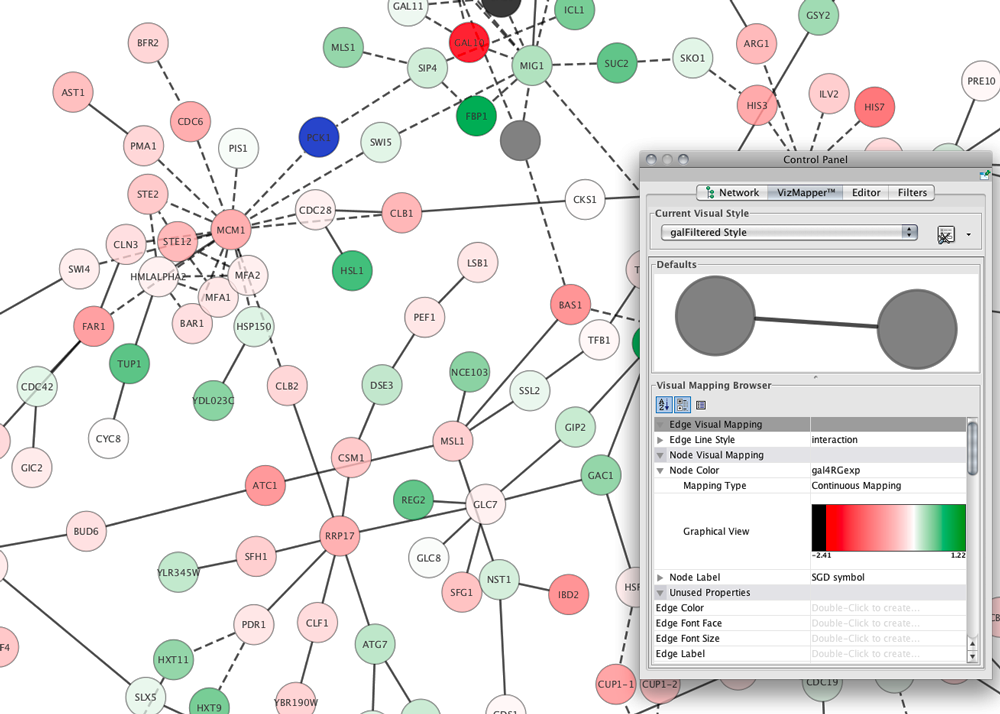
- Establish powerful visual mappings across these data
- Perform advanced analysis and modeling using Cytoscape Apps
- Visualize and analyze human-curated pathway datasets such as WikiPathways, Reactome, and KEGG.
Cytoscape is used by social scientists to:
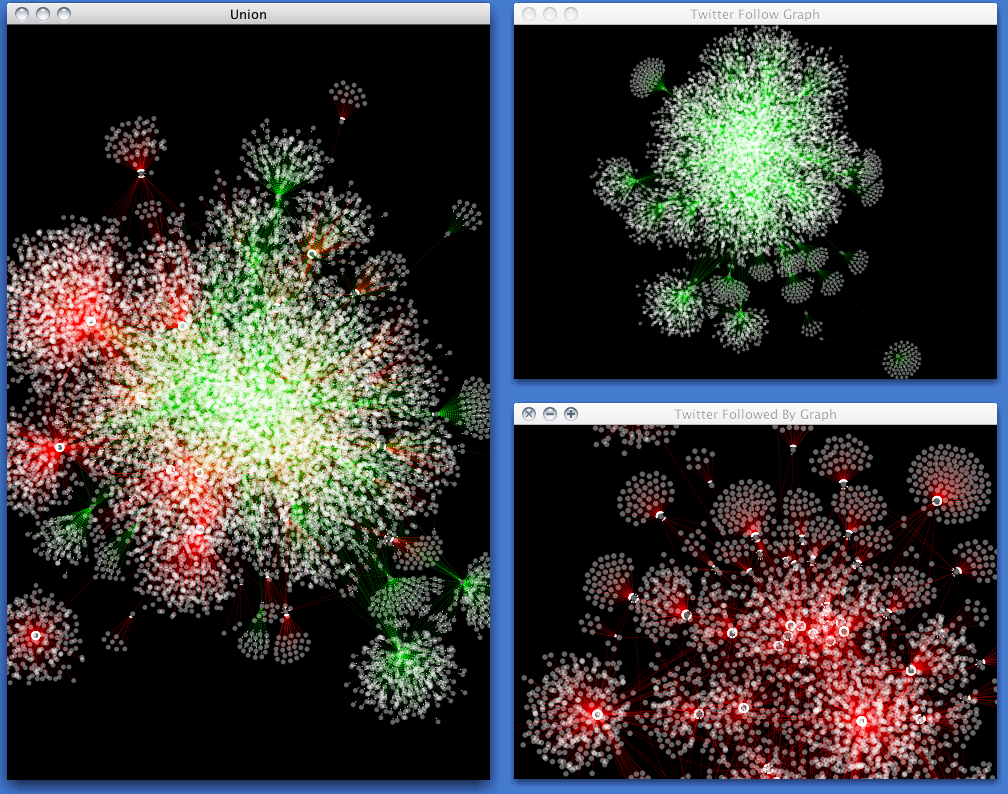
- Visualize and analyze large social networks of interpersonal relationships
- Assemble social networks from tables and forms
- Gather social interactions from the web by variety of web service APIs with scripting languages and save it in standard data file formats. Cytoscape supports most of the standard file formats .
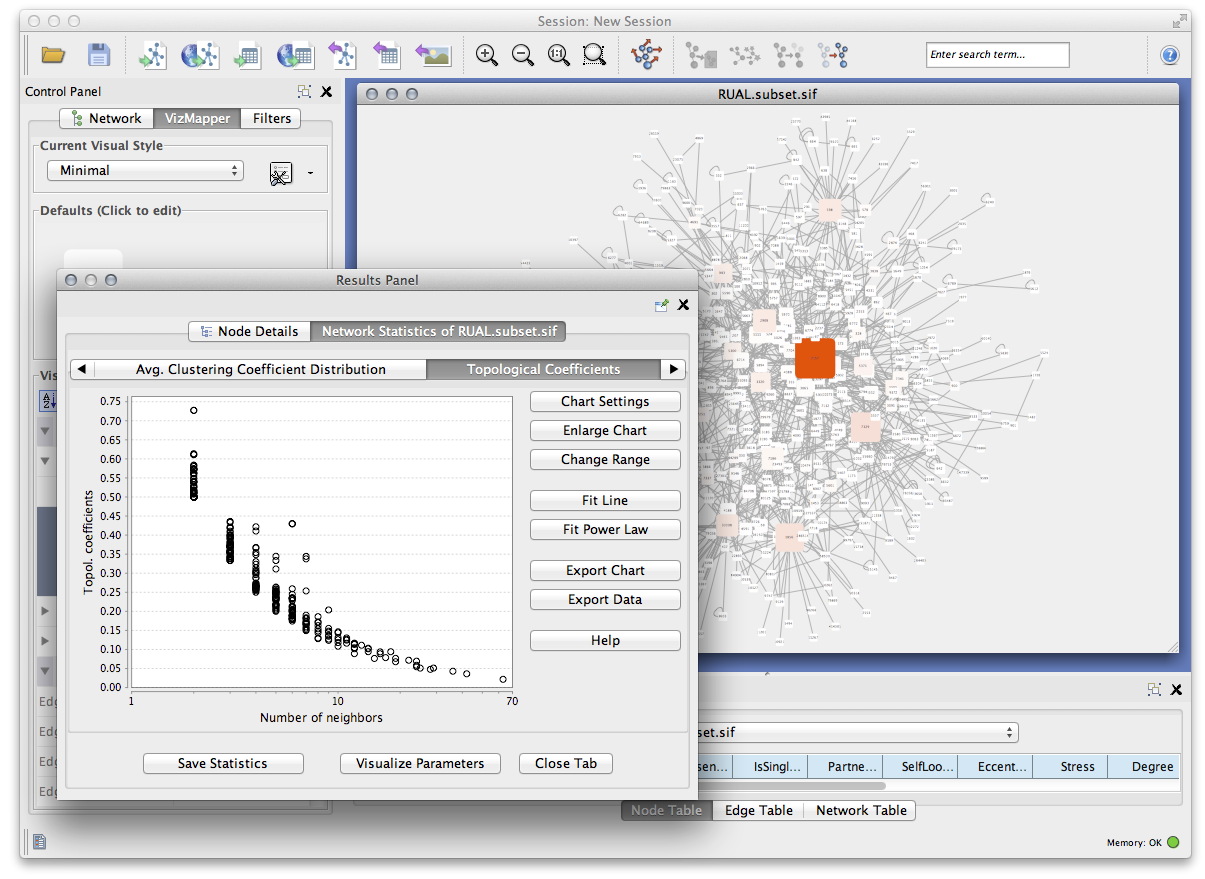
- Calculate network statistics using Apps
- Use with other tools, such as R with sna/ igraph package or NetworkX, for more advanced analysis
Cytoscape is domain-independent and therefore is a powerful tool for complex network analysis in general.
- Calculate statistics for networks by Apps such as NetworkAnalyzer or CentiScaPe
- Find shortest path
- Find clusters by various kinds of algorithms
- Use with other tools for more advanced analysis
- Perform advanced network analysis in popular tools, including igraph, Pajek, or GraphViz and import it to Cytoscape as standard file formats like GraphML
VKORC1 Analysis
Load Libraries
library(dplyr)
library(tidyr)
library(readr)
Preliminary data analysis
The two tables share the Gene column in common.
galExpData <- read_csv(file='galExpData.csv')
galFiltered_edge <- read_csv(file='galFiltered_edge.csv')
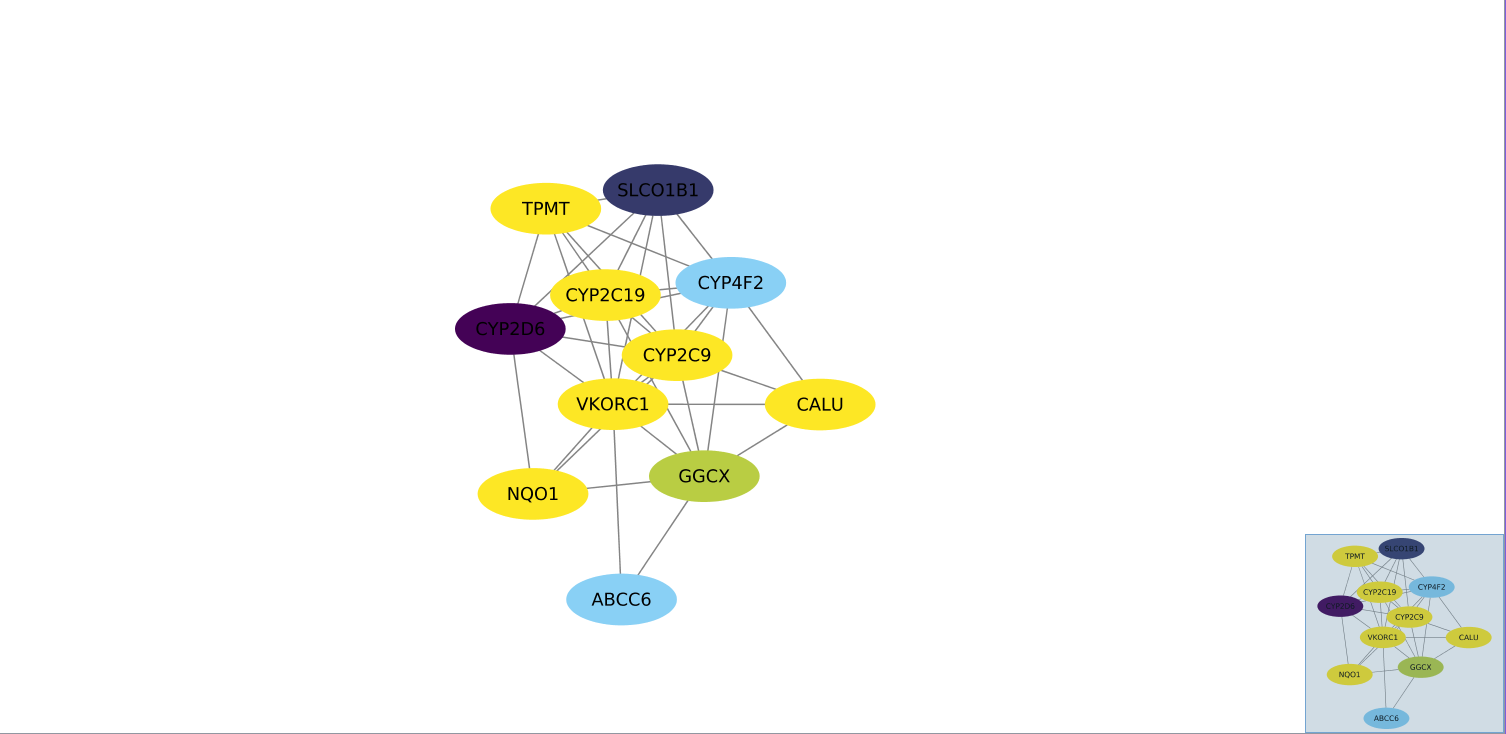
Gene Network: VKORC1
Discussion
- VKORC1 encodes the vitamin K epoxide reductase enzyme, which is responsible for converting vitamin K epoxide to vitamin K as part of the clot signalling pathway in humans. Polymorphisms in VKORC1 are shown to be significant contributors to Warfarin dose variance, a common anticoagulant prescribed for a variety of conditions. The Gene Network indicates that the neighboring gene CYP2D6 (Cytochrome P450 2D6), which is responsible for the metabolism of many drugs and environmental chemicals according to STRING, interacts significantly with VKORC1. The other genes are associated with the vitamin K metabolism pathway. I gather from this network the significance of looking at more than one gene than VKORC1 when using genetic assays to predict dosage of Warfarin. A complicated enzymatic ballet drives the metabolism of Warfarin.
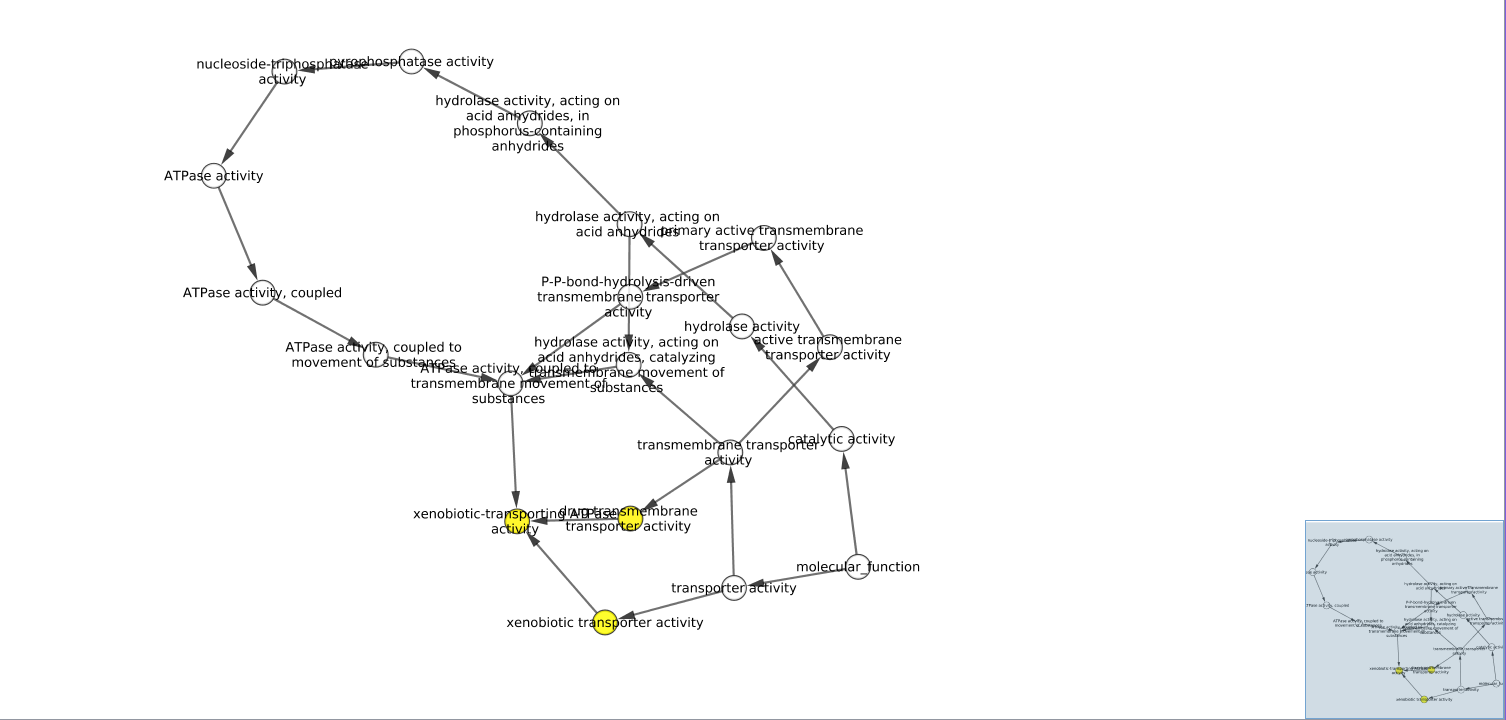
Gene Ontology Enrichment Network
Gene Ontology Enrichment Table
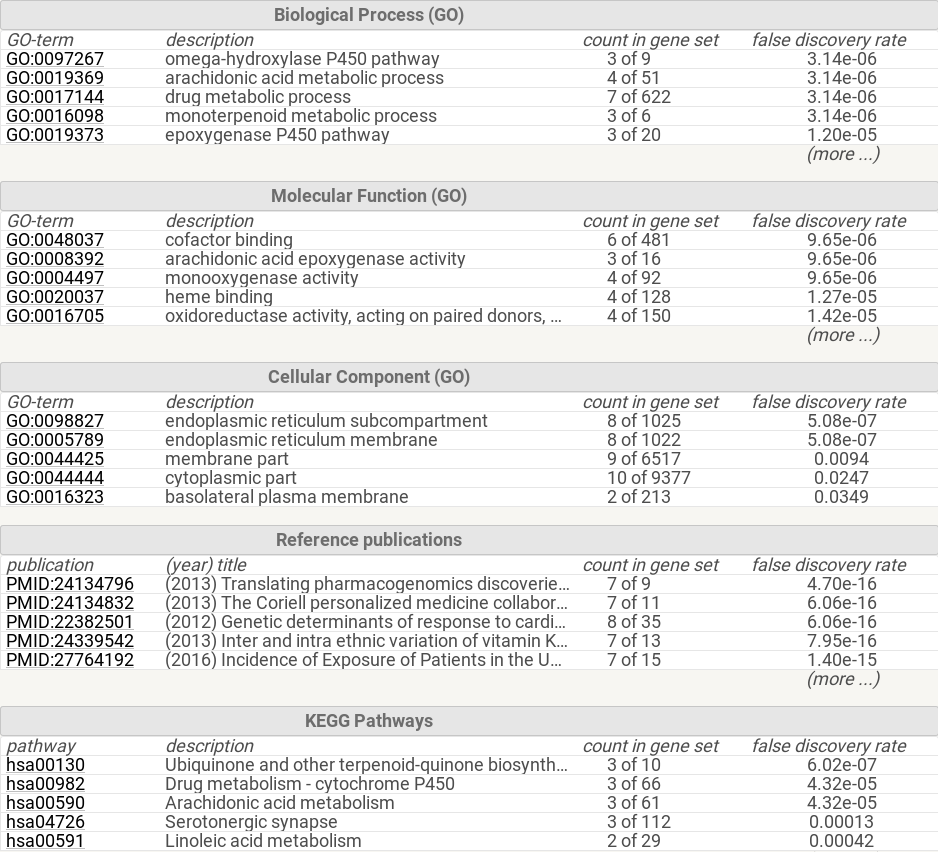
Discussion
- In discussion of the GO network, while still scientifically sound, the BINGO app did not include every detail that STRING had on their website. The terms “drug transmembrane transporter activity”, “xenobiotic transporter activity”, and “xenobiotic-transporting ATPase activity” show up as significantly enriched. This is consistent with the described roles of each enzyme included on the STRING website. The STRING GO table includes more detail, including “omega-hydroxylase P450 pathway” and “drug metabolism”, which more accurately describes the role of VKORC1 and associated genes. From these interactions I can postulate that metabolism of Warfarin involves membrane transport in and out of cells as well as oxidation by various Cytochrome enzymes.